Don't have account? Sign up here.
Diagrams
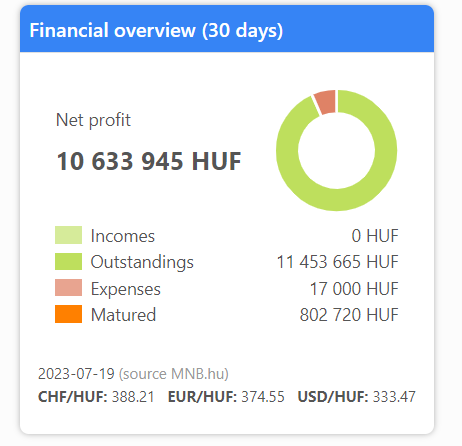
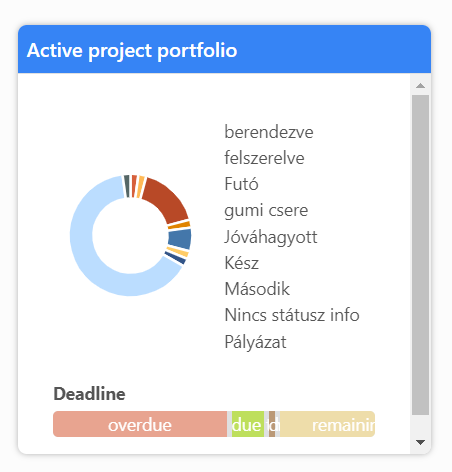
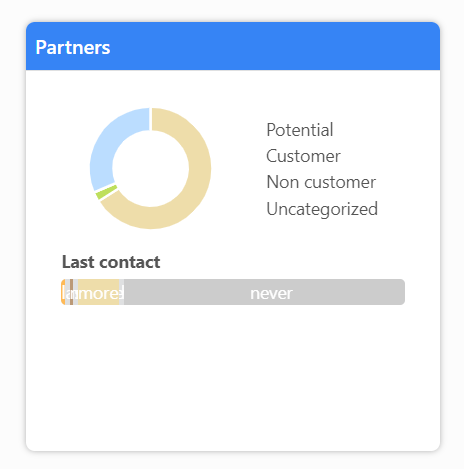
In order to make the overview easier, based on the data recorded in each module KPI (Key Performance Indicator) data were placed on the Dashboard screen as diagrams. They give you a quick, comprehensive picture of the current state of the business at a glance.
Hovering your pointer over the parts of the diagram, you can view the displayed value and clicking on a part of the graph a collation opens, which is used as the basis for the current part of the diagram calculation.
Types of diagrams in the system:
- Financial status for the last 30 days. For the past 30 days, it aggregates incomes, receivables, expenses and overdue receivables, and payables.

- Active project portfolio. This diagram shows the distribution of projects by their status:

- Partners. The Partners diagram shows the distribution of the partners by status.
